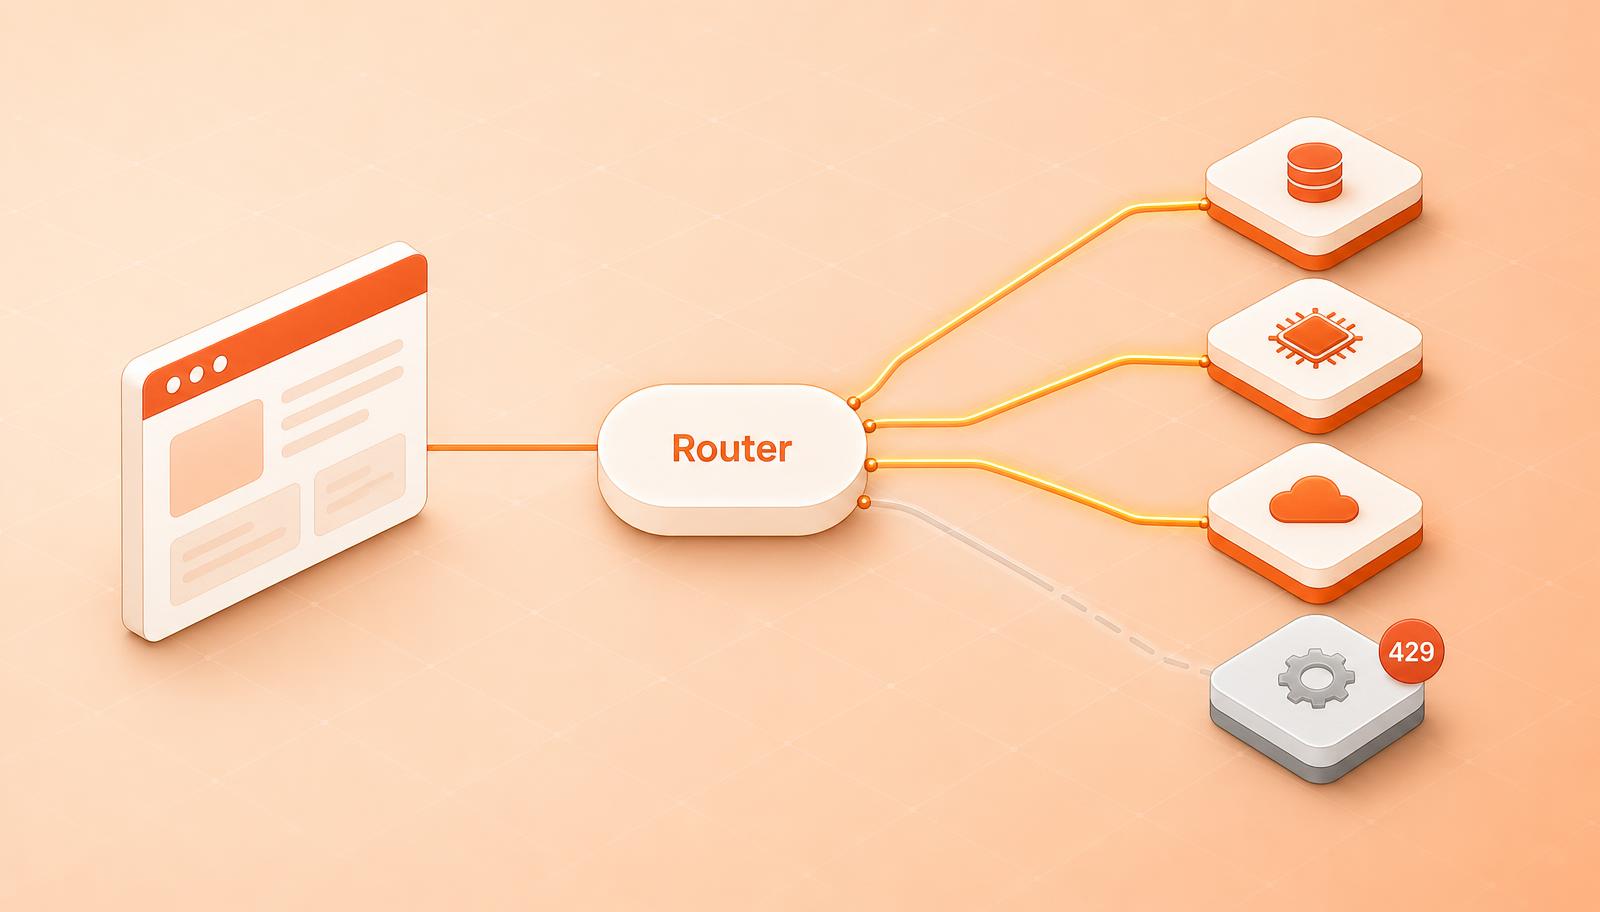
A provider can serve 40-block-old state, rate-limit your bursts, and disagree with every other node in the pool, all while its status page stays green. Here's what to watch instead.
Most RPC monitoring starts and ends with uptime: ping the endpoint, check for a 200, page someone if it stops answering. That catches the failure mode providers almost never have. The failures that actually reach production are subtler: a provider that answers fast with data from 40 blocks ago, an error rate that creeps up only on eth_getLogs, a node that returns a different balance than every other node in the pool. Uptime says a provider answered. It says nothing about whether the answer was right.
This article covers the health metrics worth watching when you run RPC infrastructure in production, why each one matters, and what alert to set on it. The metric names below are the real Prometheus series exposed by Smart Router, Magma's open-source RPC routing layer, as documented in its metrics reference. If you run a different stack, the signals still apply; you'll just have to build the instrumentation yourself.
Why uptime is the wrong headline metric
A provider status page can show green while the provider serves stale state, rate-limits your bursts, or returns malformed results on specific methods. All of those produce well-formed HTTP responses, so a liveness probe passes. Worse, a lagging node reports its own view of the chain, so asking it eth_blockNumber tells you what block it thinks is latest, which is exactly the number that's wrong. We've written before about why availability alone is not enough as a security property; the same logic applies to monitoring. You need signals that compare providers against each other and against the chain, not signals that ask each provider to grade itself.
The practical consequence: the metrics below fall into two groups. Performance metrics (latency, errors, cache) tell you the service is degrading. Correctness metrics (sync lag, cross-validation disagreement) tell you the service is lying. The second group is smaller, fires rarely, and matters more.
The RPC monitoring metrics to watch, and the alert for each
Per-provider latency, at the tail
Averages hide everything interesting. A provider whose median is 80ms and whose p95 is 4 seconds is a bad provider for user-facing traffic, and the mean won't show it. Smart Router records latency twice: smartrouter_end_to_end_latency_milliseconds gives the router-level histogram your clients experience, and rpc_endpoint_end_to_end_latency_milliseconds breaks it down per upstream endpoint and per RPC method, so you can see that one provider's eth_getLogs latency tripled while everything else held steady.
For a per-provider p95:
histogram_quantile(0.95,
  sum by (endpoint_id, le)
  (rate(rpc_endpoint_end_to_end_latency_milliseconds_bucket[5m])))
Alert: the docs suggest paging when router-level p99 exceeds 2,000ms for 10 minutes. Alert per provider too, against that provider's own baseline: a provider whose p95 doubles is degrading even if it's still under your global threshold.
Error rates, split by who caused them
A single error counter is close to useless because it mixes "the provider is failing" with "your client sent garbage." Smart Router separates these: smartrouter_node_errors_total counts errors returned by the upstream node, smartrouter_protocol_errors_total counts connection and session failures, and the classified series smartrouter_errors_total{error_name, error_category, retryable, chain_id} maps every failure to a named entry in the error taxonomy with a retryability flag.
That retryable label is the one to watch. Retryable errors (timeouts, NODE_RATE_LIMITED) are absorbed by failover and mostly cost latency. Non-retryable errors reach your application:
sum by (error_name) (rate(smartrouter_errors_total{retryable="false"}[5m]))
Alert: overall error ratio, sum(rate(smartrouter_total_errored[5m])) / sum(rate(smartrouter_total_relays_serviced[5m])), above 5% for 5 minutes. Any sustained rate of non-retryable errors deserves a separate, more sensitive alert, because those are the failures no amount of retrying fixed.
Sync lag: the stale-data detector
This is the first correctness metric. rpc_endpoint_latest_block reports the latest block each upstream claims, and smartrouter_latest_block tracks the highest block the router has seen across the pool. The difference between them, per provider, is that provider's lag, measured against its peers rather than against its own self-report. A provider 40 blocks behind on Ethereum is serving 8-minute-old state with a straight face.
The router also folds sync into a boolean: rpc_endpoint_overall_health is 1 when an endpoint is considered healthy and 0 when it isn't, and rpc_endpoint_selection_score{score_type="sync"} shows how the selection policy is scoring each node's freshness in real time.
Alert: rpc_endpoint_overall_health == 0 for 5 minutes per node, and smartrouter_overall_health == 0 for 1 minute for the router itself. Graph per-provider lag continuously; alert when it exceeds a threshold derived from the chain's block time.
Retry and hedge rates: the early-warning layer
When failover is working, your users see nothing while the router quietly absorbs upstream failures. That's the point, but it also means failures become invisible unless you watch the absorption itself. smartrouter_retries_total counts retry attempts (with smartrouter_retries_success_total and smartrouter_retries_failed_total for outcomes), and smartrouter_hedge_total counts hedged requests fired when a response was slow (the RPC glossary defines hedging and the rest of the failover vocabulary). The histograms smartrouter_retry_attempts and smartrouter_hedge_attempts show how many attempts each request needed.
The retry rate, sum(rate(smartrouter_retries_total[5m])) / sum(rate(smartrouter_total_relays_serviced[5m])), is your leading indicator. A rising retry or hedge rate with a flat client-visible error rate means the pool is degrading and failover is compensating. You have time to act before users notice; that window is the entire value of the metric.
Alert: warn (not page) when the retry ratio or hedge ratio climbs meaningfully above its baseline for 15 minutes.
Circuit-breaker trips: the pool is exhausted
The circuit breaker trips after consecutive empty-pool errors and fails the relay fast instead of retrying forever. A trip means the router looked for a usable node and found none: every upstream was lagging, erroring, or blocked. There is no dedicated trip counter; the signal shows up in three places. Trips increment smartrouter_total_errored and surface in smartrouter_errors_total as non-retryable pool errors such as PROTOCOL_NO_PROVIDERS. The gauge smartrouter_csm_blocked_providers shows how many providers are currently excluded; when it equals your pool size, a trip is imminent. And each trip is recorded as a span event on the trace, with "pairing list empty" warnings in the logs just before.
Alert: page on any occurrence of smartrouter_errors_total{error_name="PROTOCOL_NO_PROVIDERS"} increasing, and warn when smartrouter_csm_blocked_providers approaches your provider count. A tripping breaker is never noise.
Cache hit rate: quiet cost and latency control
Block-aware caching cuts both spend and latency, and a broken cache degrades silently: everything still works, just slower and at full provider cost. smartrouter_cache_requests_total and smartrouter_cache_success_total give the hit ratio, and smartrouter_cache_latency_milliseconds confirms lookups stay cheap.
Alert: the docs suggest flagging a hit ratio below 20% for 30 minutes. Tune the threshold to your traffic mix; the alert exists to catch a cache that stopped working, not to enforce a number.
Cross-validation disagreement: the high-signal alert
The second correctness metric, and the one worth the most attention. When cross-validation is enabled, sensitive reads fan out to multiple providers and require agreement before a response is returned. The metrics record the verdicts: smartrouter_cross_validation_provider_agreements_total and smartrouter_cross_validation_provider_disagreements_total track how often each provider sided with or against consensus, and smartrouter_cross_validation_failures_total{reason} explains requests that couldn't reach quorum at all.
The series to build your highest-severity alert on is smartrouter_cross_validation_mismatch_total, which counts outlier response groups and carries a finality label. Disagreement about a recent block can be an honest race: two nodes on either side of a re-org, or one node a block behind. Disagreement about finalized data cannot. Once a block is final, every honest node must return identical data for it, so a post-finality mismatch means a provider returned wrong data about settled chain state. That is either a serious bug or something worse, and it is precisely the failure that uptime monitoring, and every metric above except this one, will never catch.
Alert: increase(smartrouter_cross_validation_mismatch_total{finality="finalized"}[15m]) > 0. Zero tolerance, page immediately, and treat the provider identified by the disagreement counters as untrusted until you understand why.
Traces: from "an alert fired" to "here's why"
Metrics tell you something is wrong; traces tell you what happened to a specific request. Smart Router emits OpenTelemetry spans covering the full relay lifecycle: inbound listener, node selection, each individual retry and hedge attempt, cache lookup, and the outbound response, with W3C trace context propagated end to end. Configuration is the standard OTEL_* environment variables, so it plugs into whatever collector you already run. One production note from the docs: leave --otel-trace-body off in production, since request bodies can contain addresses and signed transactions.
Start from the prebuilt dashboard
You don't have to assemble this from scratch. The Smart Router dashboard ships as a self-contained stack (make up, dashboard on port 3000, Prometheus on 9090) and graphs chain and upstream health, latency, request volume, and error breakdowns by code, category, and retryability, with panels for cache, retries, hedging, cross-validation, and WebSocket activity appearing as those features register. You can also fire test requests at your chains from the browser and watch which upstream served them, whether the cache hit, and whether cross-validation agreed. It's a reasonable first hour of monitoring; the alerts above are the second.
Monitoring is one line item in a longer list of what production RPC infrastructure needs; the enterprise RPC checklist covers the rest.
Frequently asked questions
What metrics should I monitor for RPC health? Beyond basic availability: per-provider tail latency (p95/p99), error rates split by cause and retryability, sync lag per provider measured against the rest of the pool, retry and hedge rates as early-warning signals, circuit-breaker trips, cache hit ratio, and cross-validation agreement between providers. The correctness signals (lag and cross-validation mismatch) matter most, because they catch providers that answer quickly but wrongly.
How do I monitor RPC providers for stale or incorrect data? Asking a provider for its own latest block only tells you its self-reported view. Instead, compare providers against each other: track each provider's latest block against the highest block seen across the pool to measure lag, and cross-validate sensitive reads across multiple providers so disagreement is recorded. A mismatch on finalized data (smartrouter_cross_validation_mismatch_total{finality="finalized"}) is definitive evidence a provider returned wrong data.
Is provider uptime enough to alert on? No. Uptime confirms a provider answered; the damaging failures are answers that are slow, stale, or wrong, all of which look like success to a liveness check. Uptime belongs in your alerting as a floor, paired with latency, error-classification, lag, and cross-validation alerts that catch the failures a 200 response hides.
Smart Router is open source, and every metric named here is exposed the moment it's running in front of your existing providers. Try it with Docker Compose, or talk to us about the enterprise edition.
Sources: Smart Router documentation; Metrics reference; Traces; Dashboard; Error codes.
How exposed is your RPC stack?
Take the 2-minute Secure RPC Assessment and get a personalized risk report.
Run the assessment